Home > 3 Ways to Analyze Guide Bot Analytics
Categories: Reporting | Chatbot Docs
(Last Updated On: )
About This Article
The purpose of this article is to provide a comprehensive overview of Guide Bot Analytics.
Learn how to analyze Guide Bot performance using three different methods
The SnapEngage Guide Bot helps you instantly generate more visitor engagement with contextually appropriate messaging and guides customers to the right solution instantly. Users can build complex, multi-step Guide Bots and chain together up to 100 logical steps to provide exceptional customer experiences at a fraction of the cost and seamlessly blend human agents with chatbot automation.
Learn more about how to configure the Guide Bot here.
In order for your Guide Bot strategy to be successful, it’s critical to be able to monitor and analyze Guide Bot performance so that you can understand which aspects of your strategy are driving the results you seek and which aspects of your strategy may need tweaking or optimization. There are a variety of methods you can use to collect different data points depending on your business reporting goals, and we recommend using a combination of all three for the most comprehensive reporting and insights.
Guide Bot reporting with native SnapEngage Analytics
This method is useful for clients looking to get immediate access to bot-related analytics directly within SnapEngage, with no additional coding, software or technical expertise required. There are a variety of Guide Bot analytics that you can analyze directly within SnapEngage Analytics and all of the following metrics are part of the existing “agent-level” analytics. This method will provide information about things like Guide Bot chat volumes, chat types, response times, average chat duration for Guide Bot conversations, post-chat survey ratings for conversations handled by Guide Bots, and Guide Bot transfers data.
If you’re not yet familiar with SnapEngage Analytics in general, please also read full details about our native Analytics here and review frequently asked Analytics questions here.
Overview Report
Go to Analytics > Overview to view accumulated case volumes for a given timeframe. You can view Online conversations (including Manual Online, Proactive, Not Responded) and Offline (including Manual Offline). You can also use the Overview Report and Hourly Contact Count Report to further drill down into conversations handled by your Guide Bot(s).
If you are viewing a widget that has both human agents and one or more Guide Bots, you can segment the data accordingly to drill down further into bot performance. One easy way to do this is to add an Agent Tag to the Guide Bot(s) you want to segment out. In the Analytics Overview Report, you can then select the appropriate Agent Tag(s) on the right side to view only data and conversations associated with Guide Bots that have this tag configured. You can read more about using Routing by Tag with Guide Bot here.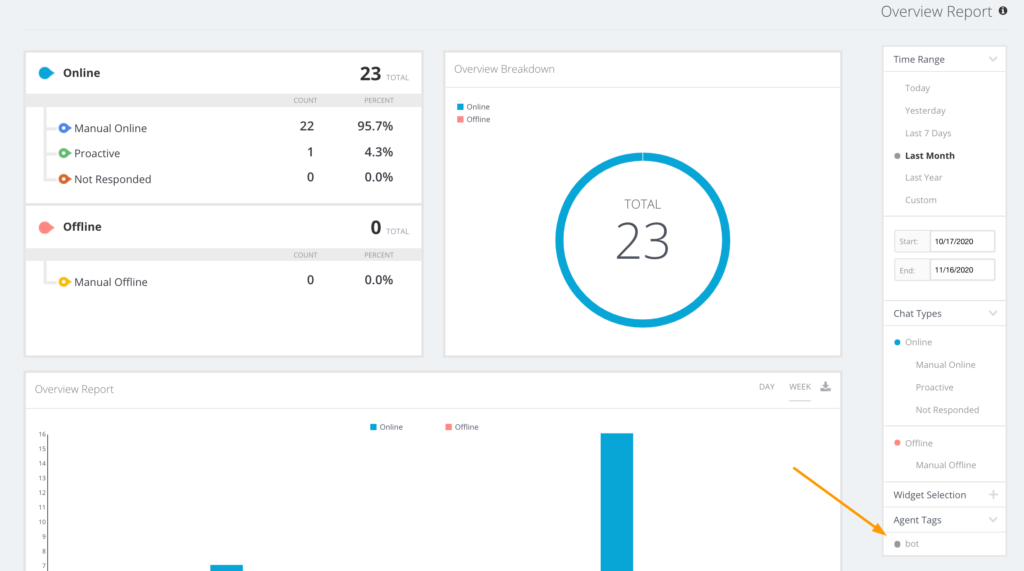
Agent Performance (includes Bots)
Go to Analytics > Agent Performance > Response to view the following data:
- Average response time: You can use this information to see how the response times for your Guide Bot and other bot conversations compare with response times for your human agents. Note that visitors that chat with a Guide Bot or other bot first can expect super fast average response times of 1-2 seconds! (Can your human agents do that?).
- Hourly average response time
- Agent Response Time Distributed Report (by day or week)
- Agent Response Time Binned Report (this shows data for Guide Bot conversations as well)
Go to Analytics > Agent Performance > Duration to view the following data:
- Average duration: Use this information to understand the overall average duration of chat conversations on this widget (including transferred chats).
- Agent duration hourly report
- Average duration by week or month
- Agent Duration Binned Report: Use this report and the drilldown below to better understand chat counts and average duration across agents and bots.
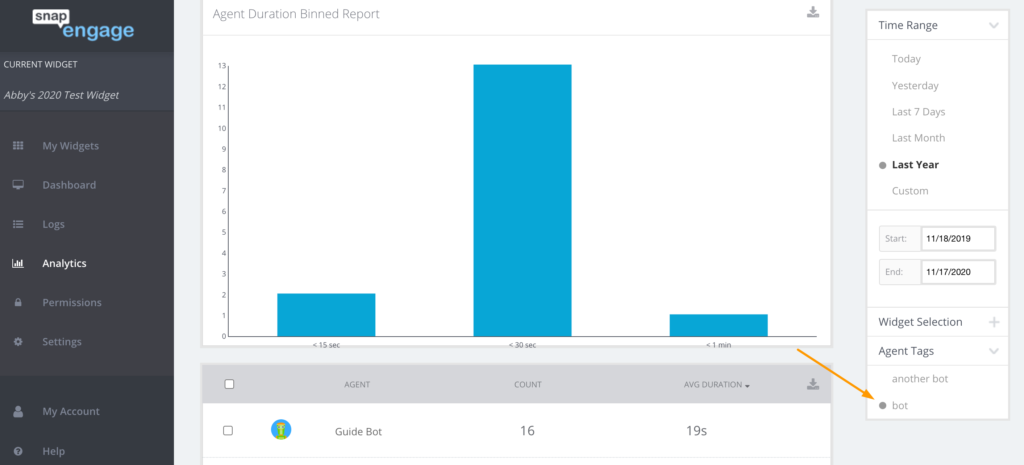
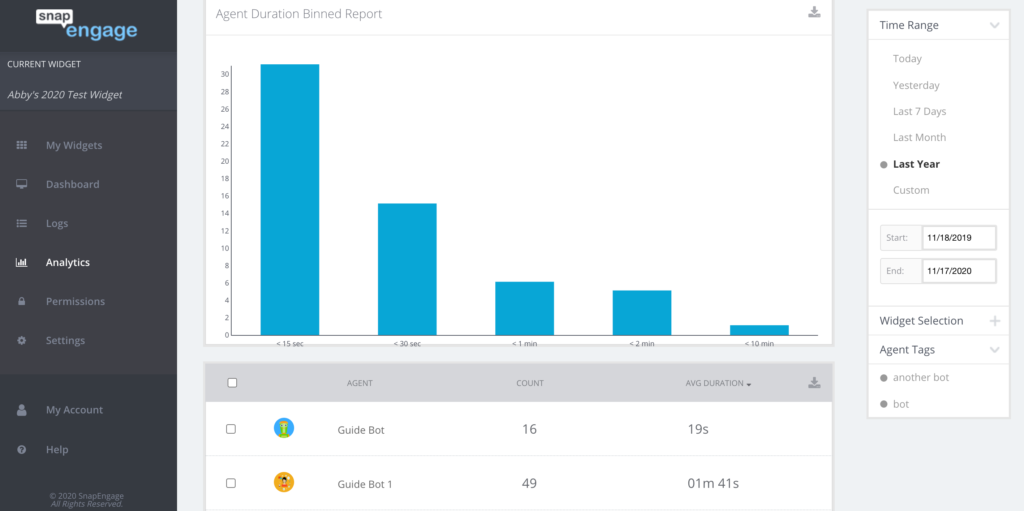 Do you have multiple Guide Bots configured in a single widget? You can specify unique Agent Tags for each Guide Bot and then use the selector on the right-hand side to select only the tags for bots whose data you want to analyze (shown below).
Go to Analytics > Agent Performance > Survey to view the following data:
- Average Survey: Use this information to view the overall average post-chat survey rating for this particular widget. (Note: If the Guide Bot transfers to an agent, the post-chat survey rating will be associated with the agent).
- Agent Survey Hourly Report
- Agent Survey Distributed Report: You can click into data points to view drilldown information below.
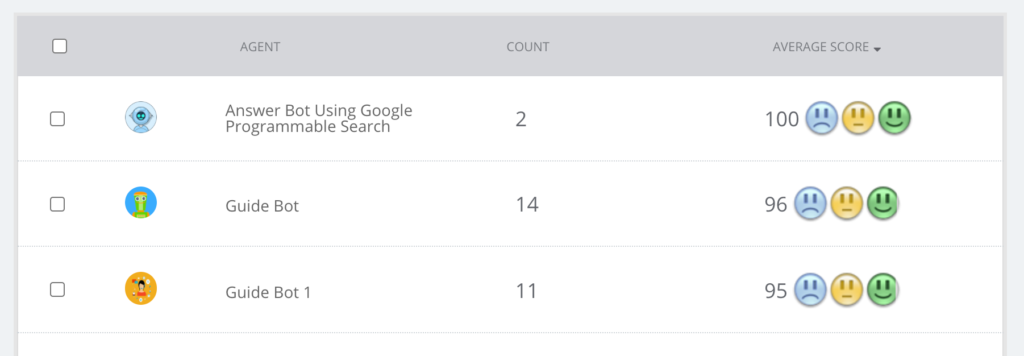
- Agent Survey Binned Report: Use this report and the drilldown information below to view specific segments and average survey scores for each of your bots (and human agents if applicable). Bots will be listed by their Internal Name (not Alias) in the Agent column of the drilldown.
Go to Analytics > Agent Performance > Transfers to view the following data:
- Widget to Widget transfers: Represents when a chat is transferred from one widget to another. If an agent or bot is both the transfer creator and receiver, then the transfer will be counted only once in the Unique Transfers column.
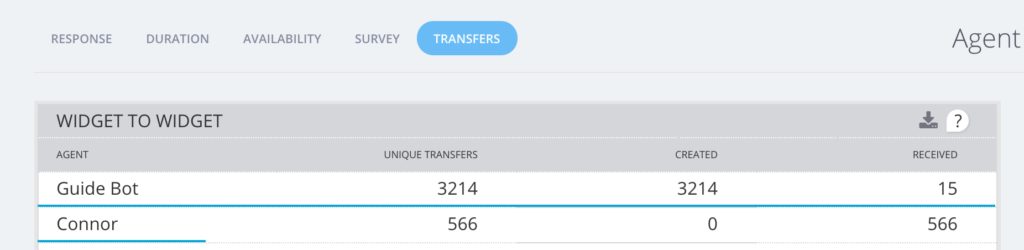
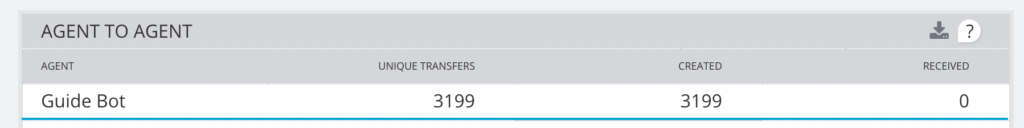
- Agent to Agent transfers: Represents when an agent or bot transfers a chat to another agent or bot, either directly or through a broadcast.
- Failed transfers: Represents when a transfer was requested, but did not go through. This could happen if either the creating agent takes the chat back or if the chat is closed before the proposed agent or bot takes the chat.
- Agent Reassignment: Represents when a chat is initially assigned to one agent, but that agent does not respond to the chat request. The chat is then assigned and responded to by the receiving agent.
Visitor Information
Go to Analytics > Visitor Information to view the following data:
- Environment: Displays operating systems, browser, etc information of website visitors who engage with Guide Bot(s). Again, to view only data related to your Guide Bot(s), please use the Agent Tags in the column on the right to filter out other human agents and bots. Alternatively, you can also easily view this data for a specific Guide Bot if you have, for example, a single widget that is dedicated to a Guide Bot.
- Pages: View Full URL, Entry URL, Referrer URL, and Search Keywords for chat conversations (use the method noted above to filter for Guide Bot conversations).
- Audience: View Language, Country and Language Group for chat conversations (use the method noted above to filter for Guide Bot conversations).
Visitor Experience
Go to Analytics > Visitor Experience to view the following data:
- Wait times: View Average Time, Hourly Average Time, Visitor Wait Time Distributed Report, and Visitor Wait Time Binned Report. Like above, you can use the drilldown to dig into specific Guide Bot conversations.
- Queue: View Average Time, Hourly Average Time in Queue, Chats in Queue vs. Total Count, and Visitor Queue Time Binned Report.
Capacity
Go to Analytics > Capacity to view the following data:
- Capacity Report: This report reflects human agent capacity only (it does not take into account bot capacity). Bots can take unlimited concurrent chats.
Bots
Go to Analytics > Bots to view analytics specifically related to the Answer Bot (note that this section does not contain Guide Bot-specific analytics at this time). You can also read more about Answer Bot Analytics here.
Labels
Read more about using Guide Bot with the new Labels Report in the following section.
Guide Bot reporting using Labels and the Labels Report
This is another useful method for clients looking to get immediate access to bot-related analytics directly within SnapEngage, with no additional coding, software or technical expertise required.
The Labels Report is a powerful tool that allows you to do more with chat. Labels are a customized way to gather more information during a conversation. They allow you to set a category for each conversation in either structured or open-ended ways. The values from the Labels can be passed to your CRM or help desk to automate workflows (for example, to set the status of a ticket directly from the chat) or to perform detailed analysis. You can combine Labels and Guide Bot to collect information and have more informed conversations before the chat even reaches a human. Chatbots can auto-assign Labels based on the button selections the visitor chooses to add further insights for comprehensive reporting.
Users have the ability to view all of this data with the Labels Report (read the full Labels Report help article here).
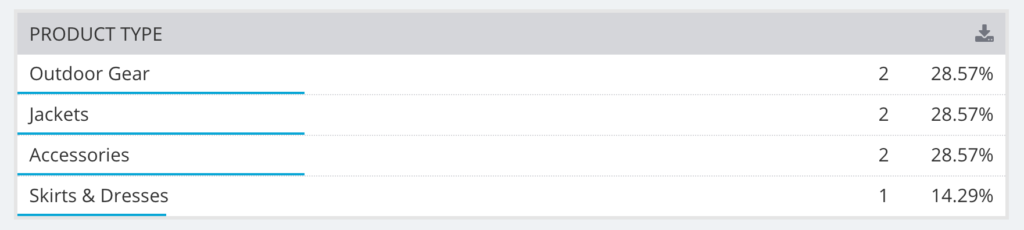
Go to Analytics > Labels to view the Labels Report. You will see that each Label has its own section, reflecting the analytics for the selected widgets and timeframe. Below is an example of how the Labels might look for a company that sells apparel and outdoor gear:
Pair Labels, Labels Report and Guide Bot to gain incredible in-depth insights about your website visitors — all from within SnapEngage. You can also custom map Labels to your CRM or help desk to automatically trigger advanced downstream workflows.
Guide Bot reporting with Google Analytics
This method is useful for clients who would like to get additional Guide Bot insights beyond the various native Guide Bot analytics offered within SnapEngage. If you would like to track metrics related to Guide Bot button selections to inform your overall reporting, this is the method to use! You can absolutely use this method in tandem with using native SnapEngage data (described above) for the most comprehensive view of performance. Keep in mind that integrating SnapEngage with Google Analytics does require you to have some prior experience with Google Analytics, JavaScript, etc so this method is for more advanced technical users.
Integrate SnapEngage with Google Analytics
Google Analytics is an incredibly powerful tool and can be integrated with SnapEngage to take your SnapEngage reporting to the next level.
Before you get started with the below instructions for tracking Guide Bot performance with Google Analytics, please ensure that you’ve already completed the general integration of SnapEngage and Google Analytics. Please view all of the following articles for full details prior to proceeding:
- How to Integrate SnapEngage with Google Analytics: Use this article to identify which version of Google Analytics you’re currently using, learn about which events to track, learn how to update your SnapEngage code snippet to implement Google Analytics tracking, and learn how to implement Google Analytics tracking for SnapEngage via Google Tag Manager.
- Tracking Events with Google Analytics: This article takes a deeper dive into Google Analytics tracking code versions, provides example code snippets for tracking SnapEngage events in Google Analytics and also provides more in-depth information about tracking commonly requested data such as proactive chat engagement rates, manual chat conversations, etc.
- JavaScript API and JavaScript Events: Use these pages to view information about SnapEngage’s JavaScript API/Events and a few example use cases. This will help you hook your custom code into JavaScript events and/or help you with Google Analytics event tracking.
Please note: This article does not cover specifics of the brand new Google Analytics 4 (released late 2020). We will update documentation in the future to reflect the latest Google Analytics version.
Benefits and downsides of Google Analytics event tracking
Once you’ve set up the initial integration of SnapEngage and Google Analytics, you can now proceed with tracking more detailed information about Guide Bot performance and usage. You can accomplish this using Google Analytics event tracking. Event tracking is simply a method that allows you to record any user interaction that happens on your website (such as form submissions, button clicks, chat interactions, etc).
Benefits of using event tracking:
- Event tracking is fairly straightforward to set up and there are a variety of SnapEngage events you can track this way
- Event tracking (unlike virtual pageviews described below) will not impact metrics like pageview count, bounce rate, etc. This means that you can ensure data integrity for your reporting needs.
- You can view three levels of data (Category, Action, Label) for highly in-depth reporting.
Downsides of using event tracking:
- Event tracking cannot be used to track user navigation and behavior by setting up goal funnels. Instead, you must use virtual pageviews to accomplish this (see below).
- While event tracking is fairly straightforward to set up, it requires strict and organized naming conventions and it’s important to think about all events you want to track well in advance prior to setting it up for the most relevant and useful data.
Analyze Guide Bot performance (i.e. button clicks, etc) with Google Analytics event tracking
As described in this article, there are all kinds of SnapEngage events that you can track with Google Analytics (such as open proactive chat, chat start, message submission, chat message received, closed chat, etc). However, this article will focus primarily on tracking detailed information about Guide Bot usage.
This data is extremely useful in understanding Guide Bot performance because it enables you to view things like Guide Bot button clicks at a very granular level and beyond what you can see directly inside SnapEngage analytics (described above). Once you have configured one or more Guide Bots, this will allow you to understand key characteristics about your visitors and understand their most commonly-requested selections when interacting with the Guide Bot.
Perhaps you have a Guide Bot that qualifies leads – this data will enable you to understand where the majority of your visitors are coming from, what products and services they’re interested in, how they fit into your existing sales territories, etc. Or perhaps you have a Guide Bot that categorizes and triages customer support requests – this data will enable you to understand which categories your most common support requests fall into, the level of severity of customer requests, and much more.
Note: We have a variety of Guide Bot templates available to jump-start your customer engagement and automation. You can learn more about them here.
Track Guide Bot button clicks with the JavaScript API Button Event
To accomplish this, you can use the SnapEngage JavaScript API Button Event to track Guide Bot button clicks. Read technical documentation here.
Once you have configured a Guide Bot, it’s time to set up tracking for clicks on Guide Bot buttons. Here’s an example snippet that you can add to your existing SnapEngage code (under the SnapEngage JS API section). Please note you may need to modify this slightly depending on which version of Google Analytics you’re currently using.
SnapEngage.setCallback(‘InlineButtonClicked’, function(options) {
gtag(‘event’, ‘BotChoice’, {
‘event_category’ : ‘SnapEngage’,
‘event_label’ : ‘BotName: ‘ + options.botName + ‘/ ButtonValue: ‘ + options.buttonValue
});
});
View the SnapEngage data in your Google Analytics account
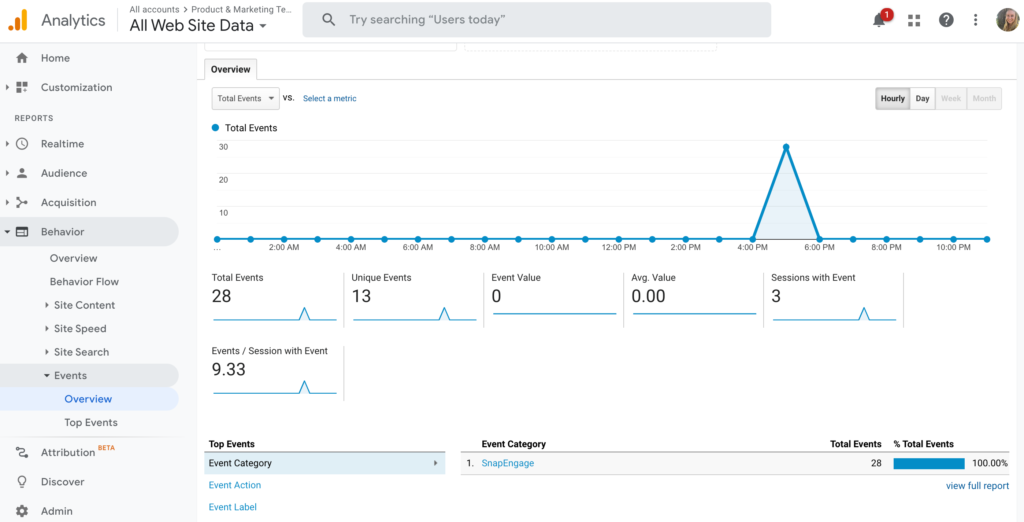
After you’ve updated your SnapEngage snippet with the correct event tracking, navigate to Google Analytics to view the data flowing in. To view Guide Bot data, navigate to Behavior > Events > Overview.
This example uses a Guide Bot called Lead Qualification Guide Bot that’s installed on a website for a marketing and client services consulting firm. As you can see below, there were 28 total SnapEngage events.
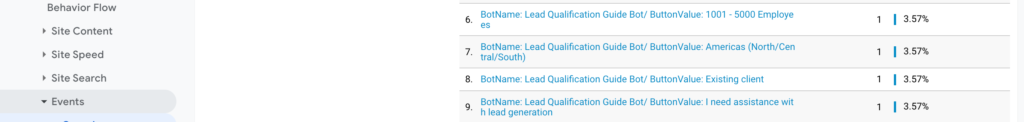
Next, navigate to Behavior > Events > Overview > Event Label.
From this view, you’ll be able to see data and percentages for Guide Bot button selections. The below example shows detailed Google Analytics Event Label data for the Lead Qualification Guide Bot. For the period of time specified, you can view button selections/button values at a glance which enables you to better understand Guide Bot performance and understand critical characteristics about your website visitors (such as top reasons for contacting your business, services or products visitors are most interested in, visitor geolocations, etc).
In the below example, you can see information about which bot visitors interacted with, what types of services visitors needed, as well as the visitor’s geolocation and company size. This type of data (both on its own or when combined with other additional data) can be incredibly valuable in informing marketing, sales and client success engagement strategies.
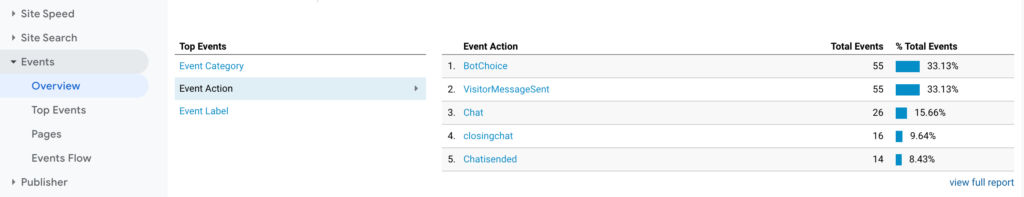
You can also view Behavior > Events > Overview > Event Action to view comprehensive Event Action information:
Alternative method: Analyze Guide Bot performance (also proactive metrics, etc) with Google Analytics virtual pageviews
While this article does not cover detailed implementation information related to this method, it’s important to understand that you have additional options for tracking Guide Bot performance (and SnapEngage performance in general) beyond event tracking. As an alternative method, you can use Google Analytics virtual pageviews to track Guide Bot analytics, proactive chat metrics, and more. Below we’ve described some pros and cons of this method so that you can consider what might work best for your business operations and reporting goals.
You can also read more details about virtual pageviews implementation here.
Benefits and downsides of Google Analytics virtual pageviews
Benefits of using virtual pageviews:
- Tracking virtual pageviews allows you to report on these actions within a Google Analytics goal conversion funnel (i.e. Funnel Visualization Report) either on the same website or across different websites. This is not possible with event tracking.
- Tracking virtual pageviews allows you to track a simple goal completion as well.
Downsides of using virtual pageviews:
- Tracking virtual pageviews will impact other reporting metrics such as total pageviews, pages per session, and bounce rate. This happens because any virtual pageview that fires will be treated by Google Analytics as a non-bounced visit and could therefore impact the accuracy of your bounce rate reports. It’s up to you to determine how significantly this might impact your data (and business decisions made based on this data). For some clients, this may not actually be a significant issue. On the other hand, tracking using Events will not impact these website reporting metrics in any way.
Did you find this article helpful?
 (2 votes, average: 5.00 out of 5)
Published December 15, 2020